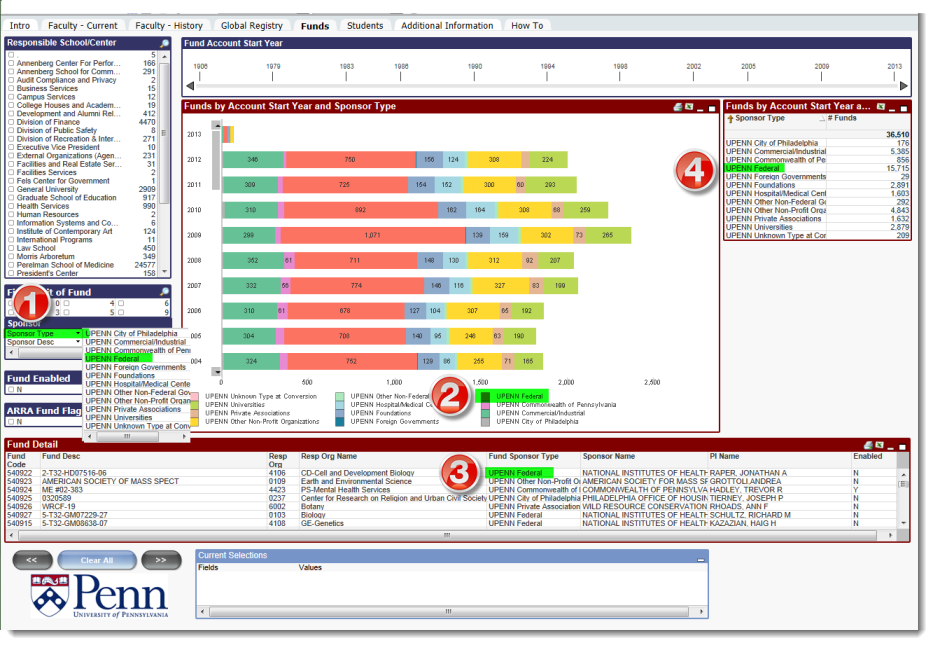
With a quick click, you can easily drill down through information on the screen and see all of your original tables and charts populated with the new information. For example, in the below screenshot, you can click on any of the 4 highlighted locations to drill down for more information about federal fund sponsors.
Initial QlikView screen with no selections
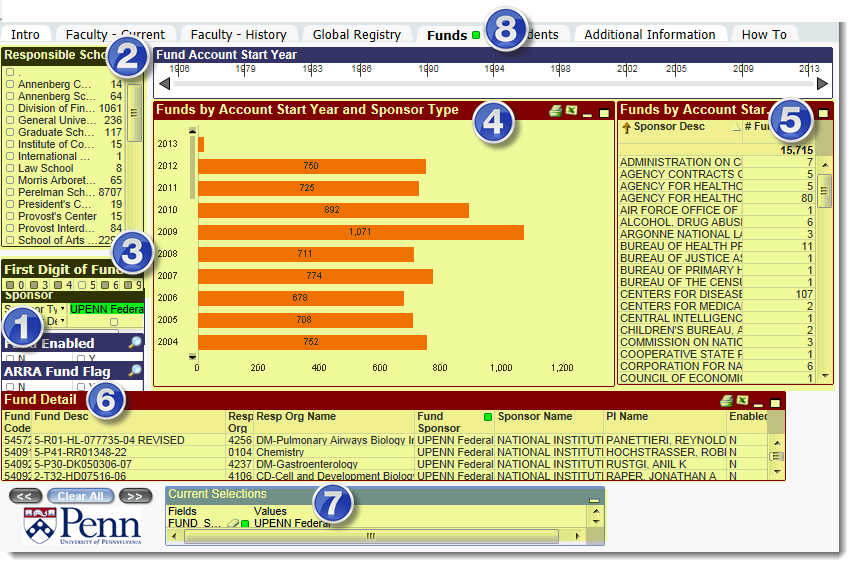
QlikView screen with UPENN Federal selected as sponsor type
Each of the highlighted, numbered screen objects changed as a result of drilling down:
- Sponsor list box: UPENN Federal now highlighted in green as the selection
- Responsible Schools list box: Numbers on right have changed indicating the number of federal funds per school. (You could drill down further by selecting just one school.)
- First Digit of Fund: Notice that all numbers are grey but "5" is clear showing that most of these funds are for research.
- Funds by Account Start Year and Sponsor Type chart: Bars now only represent federal funds per year with the total number of federal funds per year displayed as a number in the bar.
- Funds by Account Start Date and SFS Category: Now only displays federal fund descriptions and numbers.
- Fund Detail: Only showing federal fund details. Note the small green square in the Fund Sponsor column, indicating that it was the selection.
- Current Selections: Now lists UPENN Federal as the sponsor of the displayed funds. Note the small green box and the white "eraser" next to it that you can use to delete the selection.
A list box may contain a cyclic or drill-down group. If a drill-down group is used, selecting a single value in the list box will cause the list box to drill down and switch to the next underlying field in the group. Drilling back up can be accomplished by clicking the drill-up icon in the list box caption.